
Scale vs Scale paired
1a: Impression
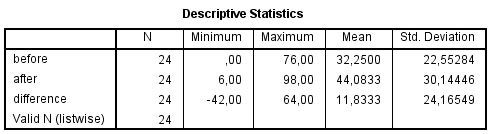
With two paired scale variables, we can begin with getting an impression from the sample data. A frequency table is often too long of a scale variable, so only some descriptive measures for each of the two variables will be used. The statistical measures of interest with a scale variable are usually the average (strickly speaking called the arithmetic mean) as a measure to indicate the center, and to indicate a bit about the variation the standard deviation is often reported. For example a company asked customers to rate their image of the company on a scale of 0 to 100, then showed them a commercial and asked the same question again. The sample data has only two variables before and after, but a third one can be of interest which is the difference between the two: difference = after - before. Table 1 shows the descriptive measurements for these three variables.
Click here to see how to determine the mean and standard deviation with SPSS, with R, or with Excel.
with SPSS
There are a four different ways to determine the mean and standard deviation with SPSS.
using Frequencies
using Descriptives
using Explore
using a shortcut
with R
with Excel
From the descriptives table we can see that the average (mean) went up from 32 to 44, but there is quite some disagreement among the customers based on the standard deviation.
A visualisation might also help to get a good impression, which will be the topic for the next page.

Google adds