3.11.1. Diagrams for a single variable using SPSS
With SPSS for some diagrams there are different options to generate the same output. The two most commonly ones are by using the Chart Builder, or the older Legacy dialogs (both under the Graphs menu). Some diagrams can also be made using the Frequencies option (the same as used for the tables), some the Explore option, and some by using an already generated frequency table or other diagram.
Table 1
Diagrams options in SPSS
| |
Chart builder |
Legacy dialogs |
Frequencies |
existing table |
Explore |
Other |
Pie chart |
|
|
|
|
n.a. |
|
Dot plot |
|
|
n.a. |
n.a. |
n.a. |
|
Cleveland dot plot |
|
n.a. |
n.a. |
|
n.a. |
|
Bar chart |
|
|
|
|
n.a. |
|
Histogram |
|
|
|
n.a. |
|
|
Stem-and-Leaf plot |
n.a. |
n.a. |
n.a. |
n.a. |
|
|
Frequency Polygon
(nominal or ordinal) |
|
|
n.a. |
|
n.a. |
convert bar chart (pdf - video) |
Frequency Polygon (scale) |
|
n.a. |
n.a. |
n.a. |
n.a. |
convert histogram
(pdf - video) |
Ogive
(nominal or ordinal) |
|
|
n.a. |
|
n.a. |
|
Ogive (scale) |
|
|
n.a. |
n.a. |
n.a. |
|
Pareto diagram |
|
n.a. |
n.a. |
n.a. |
n.a. |
|
Unfortunately I'm not aware of any method to generate Pictogram with SPSS. Perhaps this is possible using the programming language (syntax) from SPSS, but in the graphical user interface I have not come across any way to show any of these.
SPSS also has something known as the graphboard template chooser, but I found this to be very limited.
Note that the Chart Builder has almost all of the diagrams (except the Stem-and-Leaf plot). It is therefor also my usual method of creating a chart with SPSS, unless I want to create diagrams of multiple variables (one by one), in which case this can be done a lot quicker with the Frequencies or the Explore option.
Below is an overview of all the different options in SPSS for single variables.
Tables with SPSS overview
| Type |
Method |
Example output |
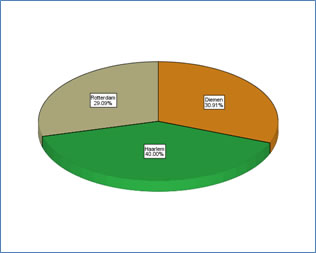
Pie chart |
Chart builder: pdf - video
Legacy dialogs: pdf - video
Frequencies: pdf - video
From a frequency table: pdf - video |
 |
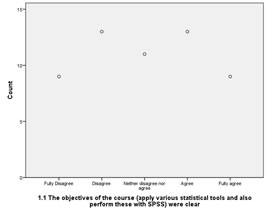
Dot plot |
Chart builder: pdf - video
Legacy dialogs: pdf - video |
 |
Cleveland dot |
Chart builder: pdf - video
From a frequency table: pdf - video |
 |
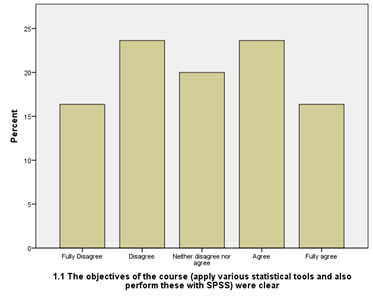
Bar chart |
Chart builder: pdf - video
Legacy dialogs: pdf - video
Frequencies: pdf - video
(note: no option to show cumulative or cumulative relative frequencies)
From a frequency table: pdf - video
(note: no option to show cumulative frequencies)
|
 |
Histogram |
Chart builder: pdf - video
Legacy dialogs: pdf - video
Frequencies: pdf - video
Explore: pdf - video |
 |
Stem-and-Leaf plot |
Explore: pdf - video |
 |
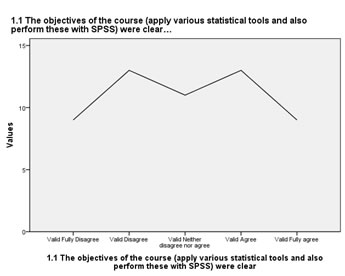
Frequency polygon
(for nominal or ordinal variables)
|
Chart builder: pdf - video
Legacy dialogs: pdf - video
From a frequency table: pdf - video
Convert Bar chart: pdf - video |
 |
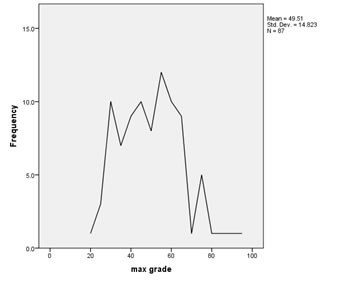
Frequency polygon
(for scale) |
Chart builder: pdf - video
Convert Histogram: pdf - video |
 |
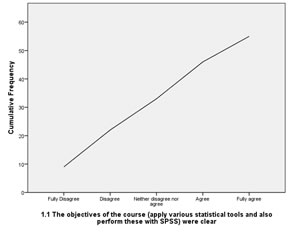
Ogive
(for ordinal (or nominal)) |
Chart builder: pdf - video
Legacy dialogs: pdf - video
From a table: pdf - video |
 |
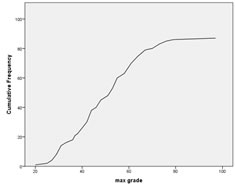
Ogive
(for scale)
|
Chart builder: pdf - video
Legacy dialogs: pdf - video |
 |
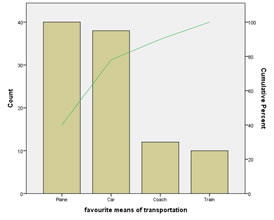
Pareto diagram |
Chart builder: pdf - video |
 |