
Figure 1. Example Frequencies output SPSS 23 or earlier
(this site uses frames, if you do not see the weblecture and definitions frames on the right you can click here)
You can generate a frequency table in SPSS either by using the Frequency option under descriptive statistics, or the Custom tables option, or a descriptive statistics shortcut.
The basic steps are:
Detailed instructions with screenshots can be found in this PDF, or you can watch the video on the right.
To generate a frequency table using the Frequency option the basic steps are:
Detailed instructions with screenshots can be found in this PDF, or you can watch the video on the right.
The output of Frequency is a frequency table as for example shown below.
Figure 1. Example Frequencies output SPSS 23 or earlier

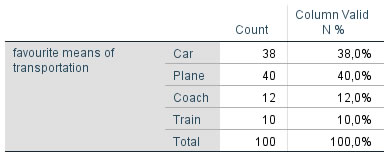
Figure 2. Example Frequencies output SPSS 24
The frequencies shown are the absolute frequency (Frequency), relative frequency in percentages (Percent), the valid relative frequency in percentages (Valid Percent), and the cumulative relative frequency in percentages (Cumulative Percent). These were all discussed before.
Note that SPSS calculates the cumulative percent, even though the variable used is nominal and the cumulative percent does not have any meaningful interpretation. SPSS does not calculate frequency densities.
The Frequencies command is often used to generate a frequency table of all variables, so they can be quickly scanned to see if there might have been some typing errors during the data entry. It could be for example someone typed a 44 instead of a 4 in the data entry, in the example frequency table we would then see under Train a 44 which would be easily spotted.
To generate a frequency table using the Custom tables option the basic steps are:
Detailed instructions with screenshots can be found in this PDF for SPSS 23 or earlier, this PDF for SPSS 24, or you can watch the video on the right.
The output of Custom tables is a frequency table as for example shown below.
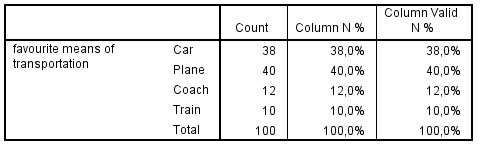
Figure 3. Example Custom tables output SPSS 23 or earlier
Unfortunately the custom tables option does not have a possibility to add the cumulative percentages.