Home - SPSS tables overview
(this site uses frames, if you do not see the weblecture and definitions frames on the right you can click here)
2.6.1.4 SPSS: Frequency or cross table of multiple response set
When entering a question that has multiple answers allowed into SPSS, you need to split each option into a separate variable. To create a frequency table or a cross table from these variables, you can let SPSS know that these belonged to each other by creating a multiple response set.
There are two methods to create a multiple response set. The first is by using the multiple responses option. The disadvantage for this method is that the set will be lost when you close the data file. The second option is to use the Multiple response set option in the Custom tables option. The set will then also be saved when you close the file.
Using the Multiple Responses
Below are the steps to generate a frequency and cross table using the Multiple Responses option. A detailed instruction with screenshots can be downloaded here, or you can watch the video on the right.
- To create the set:
- Click in the menubar on Analyze
- Click on Multiple Responses
- Click on Define Variable Sets
- Select the variables that form the set and move them to the Variables in Set section
- Enter the value at Counted value that represented a positive (usually you are interested in how many cases chose the option)
- Enter a name and a label for the set
- Click on Add
- Click on Close
- To create a frequency table from the set:
- Click in the menubar on Analyze
- Click on Frequencies
- Move the multiple response set(s) to the Table(s) for section
- Click on OK
- To create a Cross table from the set:
- Click in the menubar on Analyze
- Click on Crosstabs
- Click on the multiple response set and move it to the Row(s)
- Click on the variable you want to cross with and move it to the Column(s)
- Click on Define Ranges
- Specify the range of codes for the values you want to show
- Click on Continue
- In case you want to see percentages
- Click on Options
- Tick the type of percentages you want (based on row totals, column totals and/or entire total)
- Click on Continue
- Click on OK
An example of what the output might look like is shown below.

Figure 1.
SPSS 23 Multiple Answers Frequency table Output

Figure 2.
SPSS 24 Multiple Answers Frequency table Output

Figure 3.
SPSS 23 Multiple Answers Cross table Output
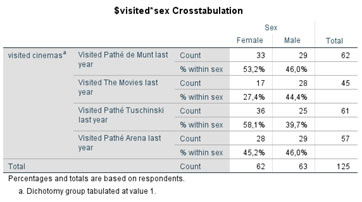
Figure 4.
SPSS 24 Multiple Answers Cross table Output
Using the Custom Tables
Below are the steps to generate a frequency and cross table using the Custom Tables option. A detailed instruction with screenshots can be downloaded here for version 23 or older, or here for version 24, or you can watch the video on the right.
- To create the set:
- Click in the menubar on Analyze
- Click on Tables (or in version 23 on Custom Tables)
- Click on Multiple Response Sets
- Select the variables that form the set and move them to the Variables in Set section
- Enter the value at Counted value that represented a positive (usually you are interested in how many cases chose the option)
- Enter a name and a label for the set
- Click on Add
- Click on OK
- To create a frequency table from the set:
- Click in the menubar on Analyze
- Click on Tables (or in version 23 on Custom Tables)
- Click on Custom Tables
- Drag the multiple response set (at the bottom of the variables list) to the Rows
- In case you want to see percentages:
- Click on Summary Statistics
- SPSS 24: Expand the Column Percent section in Statistics
- Click on Column Valid N%
- Move it to the Display section
- Click on Apply to Selection
- SPSS 24: Click on Close
- In case you want to see the totals:
- Click on Categories and Totals
- Tick the Total option
- Click on Apply
- Click on OK
- To create a cross table from the set:
- Click in the menubar on Analyze
- Click on Tables (or in version 23 on Custom Tables)
- Click on Custom Tables
- Drag the multiple response set (at the bottom of the variables list) to the Rows
- Drag the variable you want to cross with to the Columns
- In case you want to see percentages:
- Click on Summary Statistics
- SPSS 24: Expand the Column Percent section in Statistics
- Click on Column Valid N%
- Move it to the Display section
- Click on Apply to Selection
- SPSS 24: Click on Close
- In case you want to see the totals:
- Click on the row variable (the multiple response set) in the table preview
- Click on Categories and Totals
- Tick the Total option
- Click on Apply
- If you also want the total column (showing the row totals), click on the column variable in the table preview and repeat the previous three steps.
- Click on OK
An example of what the output might look like is shown below.
.jpg)
Figure 5.
SPSS 23 Multiple Answers Frequency table Output
.jpg)
Figure 6.
SPSS 24 Multiple Answers Frequency table Output
.jpg)
Figure 7.
SPSS 23 Multiple Answers Cross table Output
.jpg)
Figure 8.
SPSS 24 Multiple Answers Cross table Output