
Analysing two scale variables
Part 4: Reporting
If we combine all the reporting bits from the example, the full report for this variable, might have looked something like:
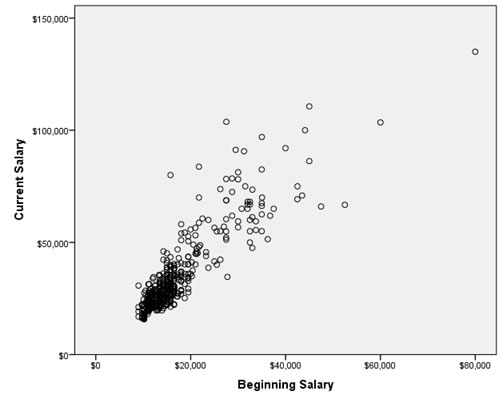
HRM is interested to know if the beginning salary can be used to predict the current salary. From a sample of employees the scatterplot in Figure 1 was produced.
As can be seen Figure 1 it appears that there is an upwards correlation between the beginning and the current salary. The result of the regression indicated that the two variables have a significant very strong correlation, F(1, 472) = 1622.12, p < .001, R2 = .775. As was expected a high beginning salary correlates with a high current salary. The beginning salary could therefor be used to predict someone’s current salary. An example of this will be discussed in the next paragraph…. |
Note the final paragraph explains the some-what technical results into more understandable English, something many readers would often appreciate.
We have not actually discussed how the beginning salary can be used for a prediction. This will be discussed in the bonus section.

Google adds