
Distributions
Wilcoxon Signed Rank
If we have \(n\) unique ranks, we first determine all possible combinations that these could be split between positive and negative deviations.
If we have for example 4 different ranks, none of them could have been belonging to a positive difference, only the first one, only the second one, only the third, only the fourth, the first and second, first and third, first and fourth, etc.
In general there will be \(2^n\) possible combinations.
Next, for each possible combination, we sum up the ranks of the positive deviations. The frequency of each of the possible sum is then the permutation distribution.
Since we also know the total number of possible combinations, by dividing each of these frequencies by \(2^n\) we have a probability mass function (pmf).
A few pmf's with different values of n are shown in figure 1.
Figure 1.
Wilcoxon Signed Rank Examples

The shape quickly starts looking like a bell-shape, and indeed the distribution is very often approximated using a normal distribution.
Use some software (easy)
to be added...
Use tables (old school)
If we have the sum of the ranks we can use a table with critical values as shown in figure 2.
Figure 1.
Wilcoxon Signed Rank Critical Values Table
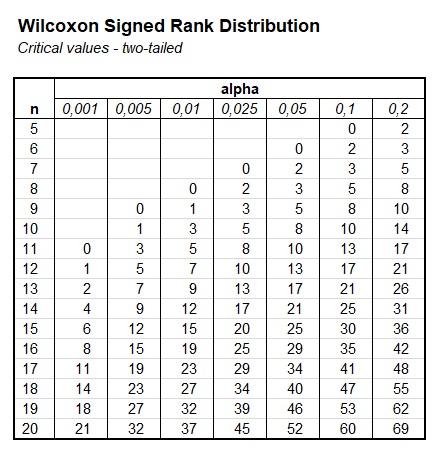
If we have a sample size of 15, and an alpha level of 0.05, we can see from the table that the critical W value would be 25. This means that if the smallest of the two sum of ranks (the sum of the positive differences, or the sum or the negative differences) is equal or lower to this 25, the result can be considered significant.
I also made a table showing the p-values given a sample size and sum of ranks, shown in Figure 2.
Figure 2.
Wilcoxon Signed Rank Cumulative Table
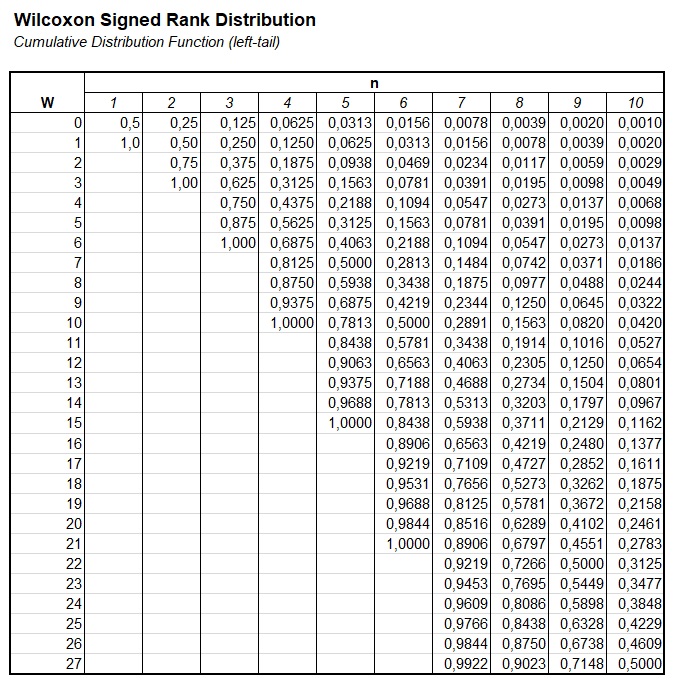

If for example the sample size would be 15, and our W would be 25, we can find the one-sided p-value of 0.024, which becomse 2 × 0.024 = 0.048 for a two-sided test.
Do the math (hard core)
The difficult part in doing the calculations, is determining how many possible combinations there are to get a specific sum of positive ranks.
One formula to do this is shown below. This was found on 'Real Statistics using Excel', and is taken from Algorithm AS 62 (Dinneen & Blakesley, 1973)
\( srf\left ( x,n \right ) = \begin{cases} 0 & \text{ if } x < 0, \text{ or } x> \binom{n+1}{2}\\ 1 & \text{ if } n=1 \text{ and }\left(x=0 \text{ or } x=1\right) \\ srf^*\left(x,n\right) & \text{ if } n\geq =0 \end{cases} \)
\( srf^*\left(x,n\right)=srf\left(x-n, n-1\right) + srf\left(x, n-1\right) \)
Example
Let's say we wanted to know a rank sum of 5, if there are 4 data points
So, \(x = 5, n=4\). The iterative steps are shown in Figure 1.
Figure 1.
Wilcoxon Signed Rank Example - Top Down

Once we have all the end values, we can work bottom-up to find the result. This is shown in Figure 2.
Figure 2.
Wilcoxon Signed Rank Example - Bottom Up
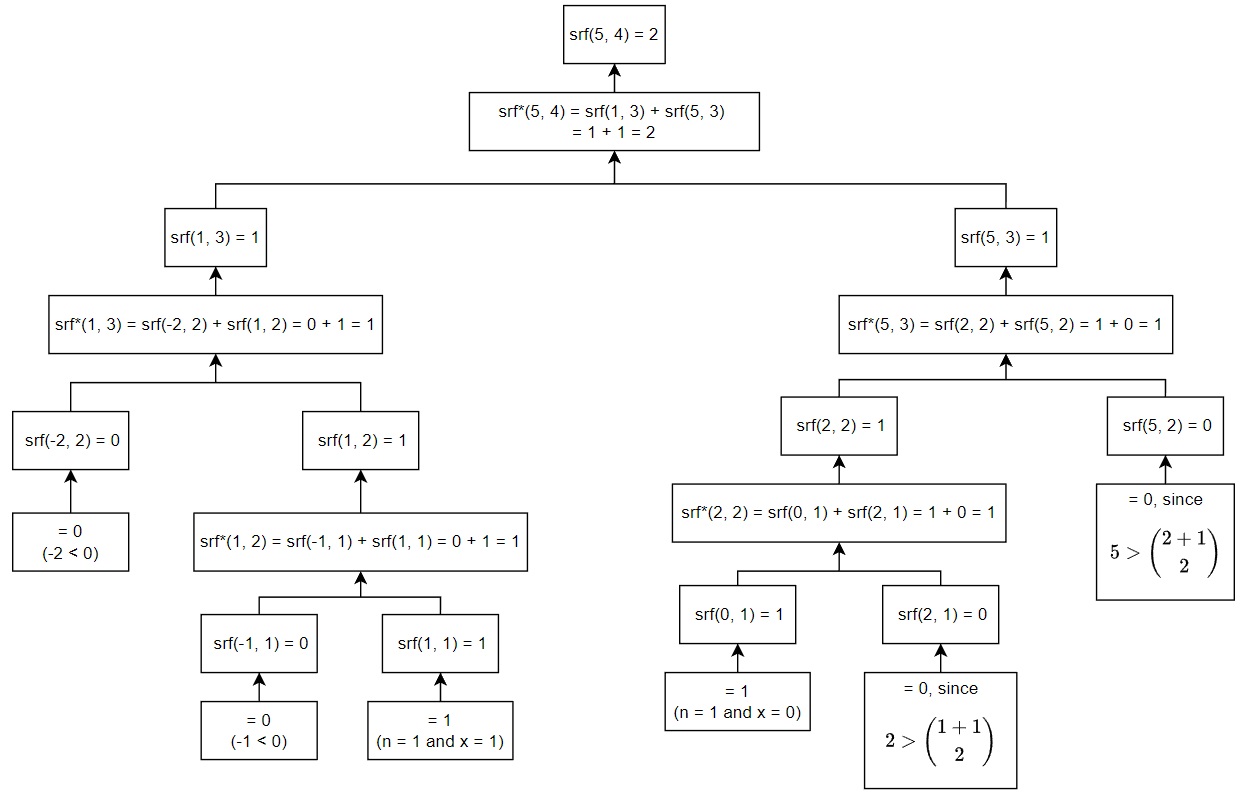
So afer a long calculation we end up with \(srf\left(5,4\right)=2\), indicating that there are only two possible combinations that will lead to a sum of 5, if there are 4 data points. These are of course the first and fourth being positive (1+4 = 5), and the second and third (2+3=5).
Dividing this by the total number of possible sums, i.e. \(2^n = 2^4 = 16\), give the probability, in this case: \(\frac{2}{16}=\frac{1}{8}=0.125\)
Distributions
![]()

Google adds