
Analysing two ordinal variables
Part 1: Impression of the sample data
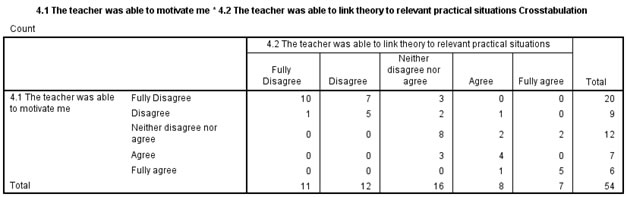
In the example to be used, I'm interested in a potential relationship between what students think of the teacher's ability to link theory to practical situations, and his/her ability to motivate the student. If such a relation exists it would either be that the more a student agrees to one of the statements, the more s/he agrees to the other, or a negative relation where the more a student agrees to one of the statements the les s/he agrees to the other. To begin analysing a potential relation between two ordinal variables we start by having a look at the sample data raw counts by creating a cross table as one shown in Table 1.
Click here to see how you can create a cross table as above with SPSS, with R, or with Excel
with SPSS
There are a two different ways to create a cross table with SPSS.
using Crosstabs
using Custom Tables
with R
with Excel
From the cross table you might notice that on the diagonal left up to bottom right there seem to be some more frequencies than in the other cells. This might be difficult to see though, so perhaps a visualisation might be easier. On the next page we'll do just that.

Google adds