
Ordinal vs Ordinal paired
Part 1: Impression
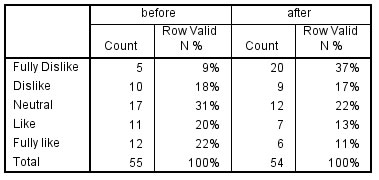
With paired ordinal variables we are interested to know if there is a difference in the overall distribution. To get a first impression we could generate a cross table showing the total frequencies in each ordinal variable for each category. For example we might be interested if there is a difference in opinion on a brand before seeing the commercial and after.
Table 1
Sample results before and after seeing commercial
Click here to see how to create a cross table as shown with SPSS, with R, or with Excel.
with SPSS
with R
with Excel
With Excel it shouldn't be too difficult to adjust the instructions shown in the video below to be used with paired data.
Upon inspection of Table 1 we can see that for the before the opinions seems to be spread out across the five categories, but for after the first category (fully dislike) seems to have a high percentage.
We could also check where the middle is for each variable, i.e. the value (category) for which 50% of the cases (respondents) had a score equal or higher, and 50% of the cases (respondents) had a score equal or less to.
In the example the median for before was 3, which corresponded to the category 'neutral', while for the after it was 2, which corresponded to the category 'Dislike'. This seems to confirm what we also noticed from the table itself.
Click here to see how to determine the median with SPSS.
with SPSS
Three different methods are shown below, each will eventually give the same result.
using Frequencies
The video below shows how to obtain the median using the Frequencies option.
using Explore
The video below shows how to obtain the median using the Explore option.
using a shortcut
The video below shows how to obtain the median using a shortcut.
Perhaps a visualisation might help here as well, which will be discussed on the next page.

Google adds