
Multiple Paired Binary Variables
3: Reporting
When reporting the results there are many options. I personally prefer to do the following:
- Introduce what you have analysed and why
- Show a visualisation
- Describe what you notice from the visualisation
- Write the results of the statistical tests and effect size
- Conclude in plain English for those who don't understand all those results.
From the example that might look something as shown below.
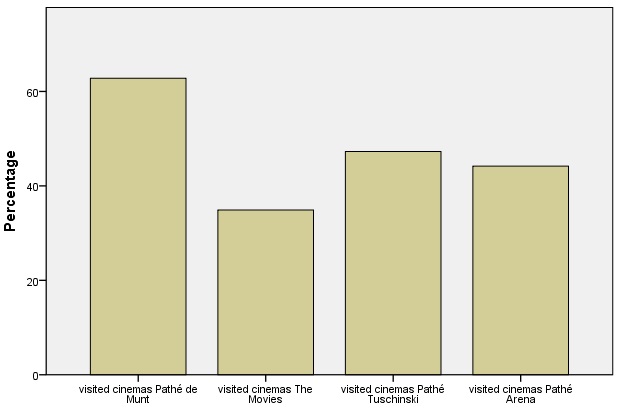
To investigate which cinemas might be preferred by residents, respondents were asked to check which cinemas they visited last year. The results are shown in Figure 1.
It appears that the Pathé de Munt cinema is visited most frequent, while The Movies the least. Cochran's Q test indicated that there are differences between the proportions among the four options of visited cinemas, χ2(3, N = 150) = 19.38, p < .001. The overall effect of the cinema on the results is relatively weak,R = .03. Although the differences are small, de Munt does perform significantly better than Arena and Movies, only Tuschinski did not differ significantly. To investigate this further interviews were held with the managers of each cinema. |
The above is just one possibility on how to report the results.

Google adds