
Multiple Paired Binary Variables
Visualisation
To visualise the results of multiple paired binary variables you can use a bar-chart, as shown in Figure 1.
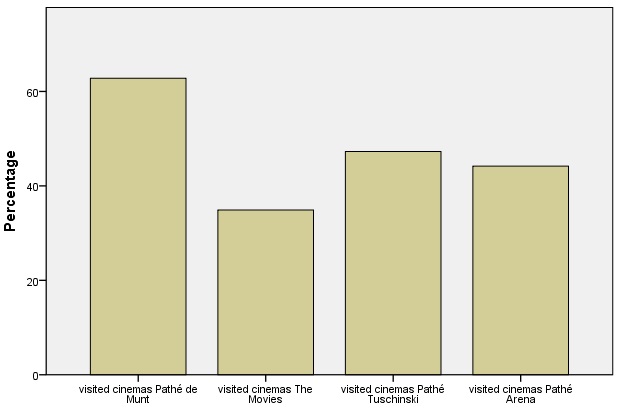
From the bar-chart we see the same results as from the frequency table: we see that Pathé de Munt is most popular in the sample with 81 visits, and The Movies the least with only 45.
Click here to see how to create the bar-chart using SPSS, R (Studio), Python, or Excel.
with SPSS
with R (Studio) (also includes table)
with Excel (also includes table)
with Python
Jupyter Notebook from video is available here.
Let's now test if the differences in percentages are also indeed significant, this will be the topic for the next page.

Google adds