
Binary vs. Binary (unpaired/independent)
Reporting
Combining the results from the previous sections, we could create a report something as shown below.
|
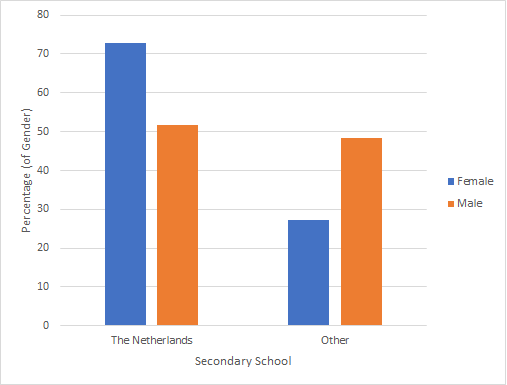
To see if there is a difference in where students got their secondary education, between male and female students a survey was conducted. The results are visualised in figure 1. Figure 1. As can be seen from figure 1, it appears that females were more likely to have their secondary education in The Netherlands, than the males However, a Fisher Exact test showed that there was no significant association between gender and secondary school, p = 0.299. Also, the Odds Ratio was 2.5, which can be classified as small (Wuensch, 2009). |

Google adds