
Multiple paired ordinal variables
3: Reporting
When reporting the results there are many options. I personally prefer to do the following:
- Introduce what you have analysed and why
- Show a visualisation
- Describe what you notice from the visualisation
- Write the results of the statistical tests and effect size
- Conclude in plain English for those who don't understand all those results.
From the example that might look something as shown below.
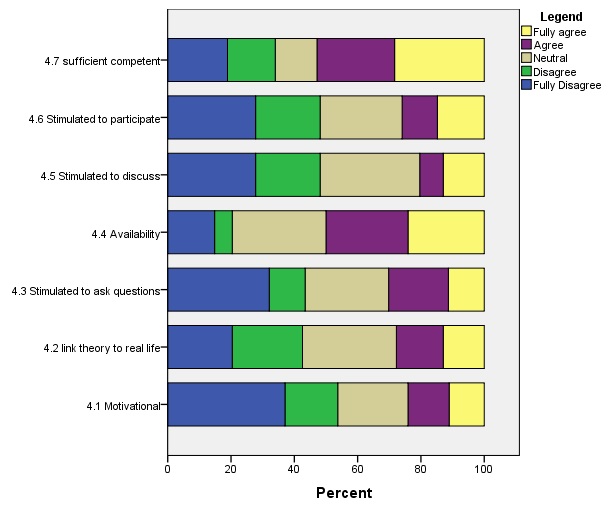
Questions 4.1 till 4.7 were all statements about the teacher, each using a scale of 1 = fully disagree to 5 = fully agree. The results of these questions are shown in figure 1.
The students seems to agree most with 4.4 and 4.7, and least with 4.1 motivational. The Friedman test indicated that there are differences between the average ranks among the seven different questions about the teacher, χ2(6, N = 52) = 49.79, p < .001. However a Kendall W of .16 indicates a weak level of agreement (according to the classification by Cafiso, Di Graziano, and Pappalardo (2013, p. 257)). It appears that the teacher is seen as being competent, and can answer questions, but his/her motivational and stimulation skills need some work. To investigate this further...... |
The above is just one possibility on how to report the results.
3+ Ordinal variables
![]()

Google adds