
Multiple paired ordinal variables
Impression
In order to get a first impression a frequency table might be helpful. In this case the table can be a cross table with the variable names on the rows and the possible categories in the columns.
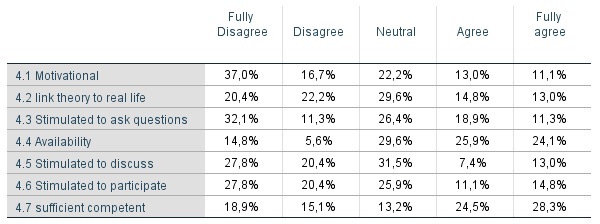
With 5 categories, we would expect 20% in each category if everything was distributed evenly. A first glimps at the table shows that the agree and fully agree categories seem to score lower except for '4.4 availability' and '4.7 sufficient competent'.
Click here to see how to create this table with SPSS, with R, or with Excel.
with SPSS (includes bar chart also)
with R
with Excel
to be uploaded
A visualisation might help here to see other issues perhaps as well.
3+ Ordinal variables
![]()

Google adds