
Multiple paired ordinal variables
Test
After we had a close look at the survey data, we would like to know what this means for our population. We could ask when we have multiple paired ordinal variables: Are there any differences between the results?
The test used to answer the question is usually a Friedman test (Friedman, 1937, 1939). This can be seen as an extension of the Wilcoxon signed rank test (although it is more an extension of the sign test). Where the Wilcoxon signed rank test is limited to two variables, the Friedmann test is an extension which will test all variables in one go.
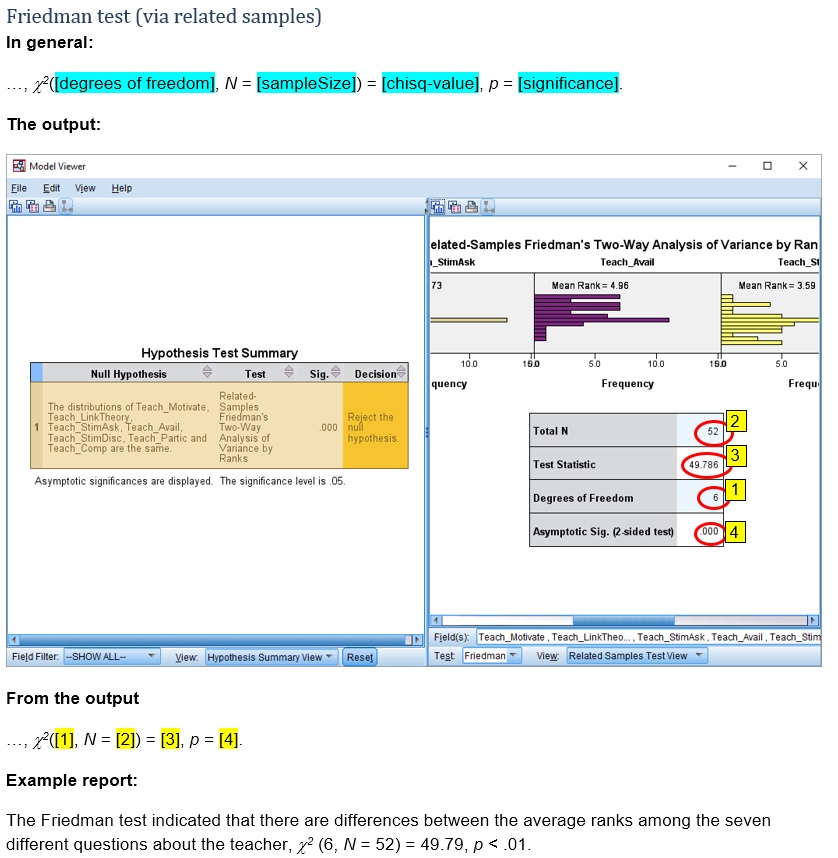
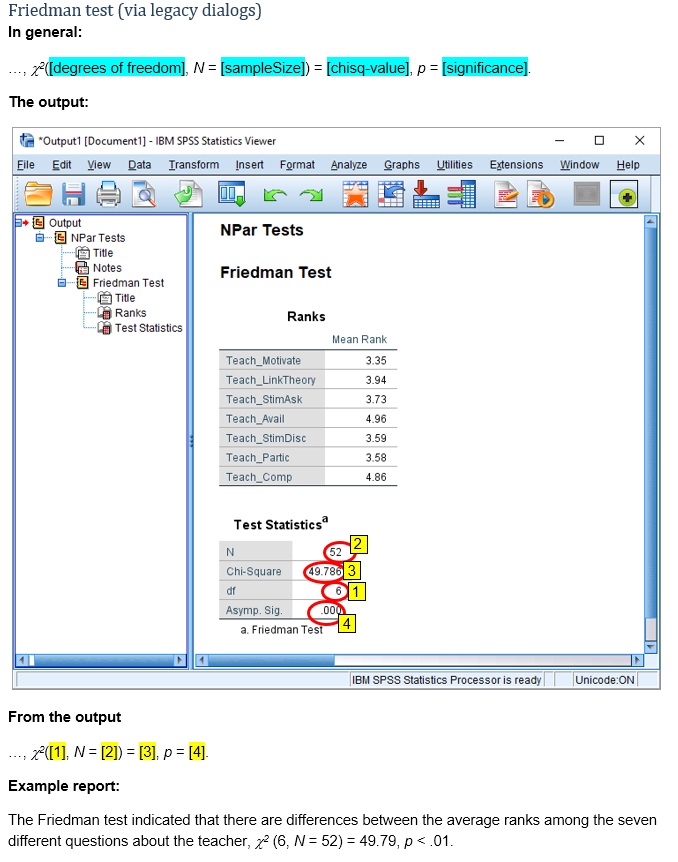
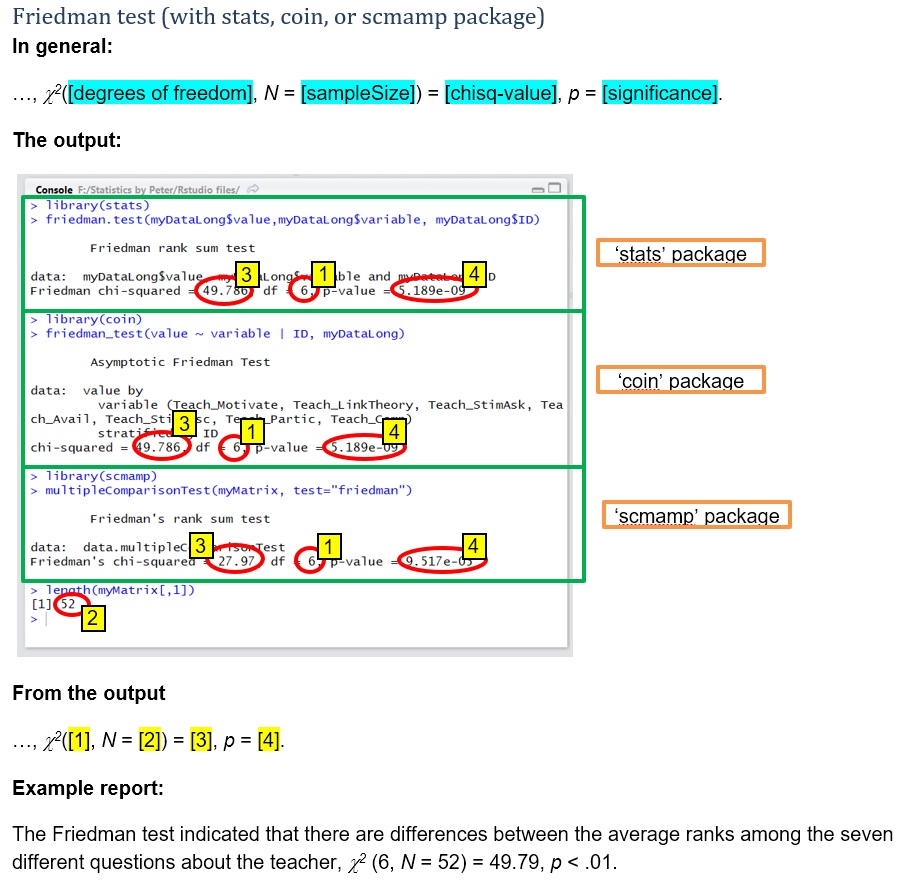
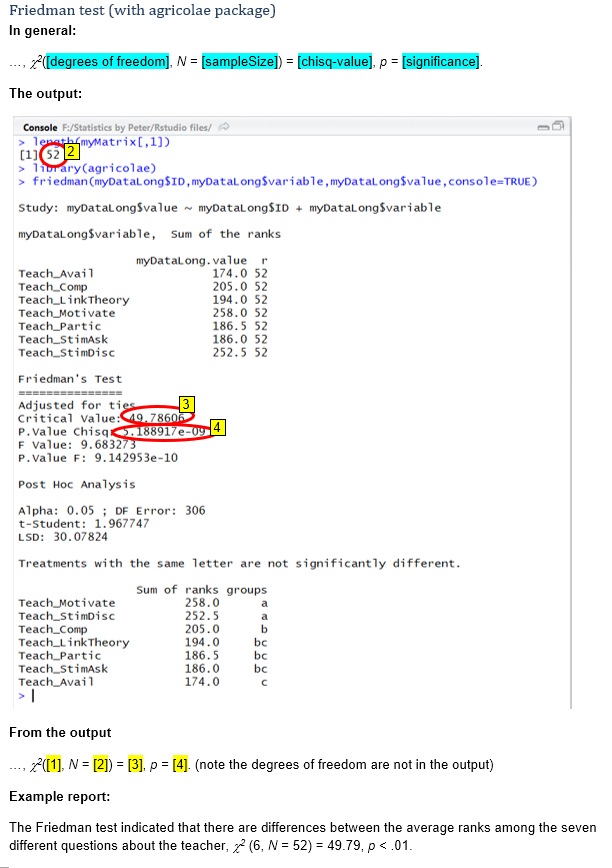
In the example data the result of the Friedman test is a test statistic of 49.786. The chance of obtaining such a test statistic, or even bigger one if there wouldn't be any differences in the population, is given by the significance of the test, which in the example is .000. This is very low, and therefor very unlikely. The conclusion would then be that most likely in the population not all variables would have the same average ranking. The test results could than be reported as something like:
The Friedman test indicated that there are differences between the average ranks among the seven different questions about the teacher, χ2(6, N = 52) = 49.79, p < .001.
Click here to see how to perform this test with SPSS, R (Studio), Excel, or Python.
with SPSS
via Related samples
click on the thumbnail below to see where to look in the output
via Legacy dialogs
click on the thumbnail below to see where to look in the output
with R (Studio)
click on the thumbnail below to see where to look in the output
Using the stats, coin, or scmamp package:
Using the agricolae package:
with Excel
with Python
Jupyter Notebook from video available here.
Of course we would then like to know, which variables had a different average ranking, which we'll discuss in the next section.
Note that Iman and Davenport (1980) showed that the original Friedman test is too conservative and devised an extension based on the F-distribution (Trawinski, Smetek, Telec, & Lasota, 2012, p. 871).
3+ Ordinal variables
![]()

Google adds