
Index (incomplete)
A current project alongside the 'functions' project
A
absolute frequency
“the number of occurrences of a particular phenomenon” (Zedeck, “Frequency”, 2014, p. 144). Discussed here.
See also frequency table
alternative ratio
Effect size for a one-sample binary test. Discussed here.
arithmetic mean
“the fulcrum that is unique to each distribution” (Weinberger & Schumacher as cited in Watier, Lamontagne, & Chartier, 2011, p. 3). Discussed here.
videos: Excel, Python, R (Studio), SPSS
average
a generic term that could refer to any measure of central tendency, although usually it refers to the arithmetic mean
B
bar chart (clustered or multiple)
“a bar chart for comparing the frequencies of a categorical variable in two or more situations” (Upton & Cook, 2014, p. 283).. Discussed here.

bar chart (compound or stacked)
“a bar chart showing multiple bars stacked at each x-axis category, each representing a value of the stacking variable” (Upton & Cook, 2014, p. 88).. Discussed here.


bar chart (simple)
“a graph in which bars of varying height with spaces between them are used to display data for variables defined by qualities or categories” (Zedeck, 2014, p. 20). Discussed here.

Bergsma correction - goodness-of-fit
Correction for Cramér's V effect size for a goodness-of-fit. Discussed here.
bimodal
Dataset with two modes. Discussed here.
binary measurement level
A variable where the scores are only consisting of two categories. Also known as dichotomous. Discussed here.
See also measurement level
binning
the process of placing numeric scores into categories (bins). Discussed here.
binomial test (one-sample)
test with a single binary variable
videos: Concept, Excel, Python, R (Studio), SPSS
functions: Description, VBA (Excel), Python, R (Studio)
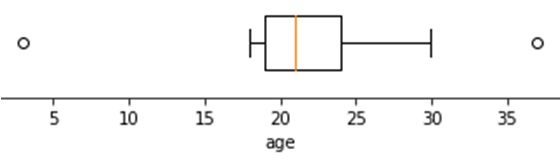
box-(and whisker) plot - simple
a chart of a scale variable showing the quartiles, median, max, min, and outliers. Discussed here.
C
Chebyshev’s inequality
states that 75% of all scores will fall within two standard deviations from the mean, and almost 89% within 3 standard deviations. Discussed here.
chi-square test
could refer to any test using a chi-square distribution. Usually the Pearson chi-square test (either of goodness-of-fit, or independence) is meant. See those for details.
Cleveland dot plot
a bar chart where instead of bars a dot is placed at the center of the top of the bar (and then the bars removed). It is a dot plot only showing the top dot. Discussed here.

videos: Concept, Excel, Python, R (Studio), SPSS
clustered bar-chart
see 'bar chart (clustered or multiple)'
Cohen's d' (one-sample)
Effect size for a one-sample Student t test. Discussed here.
videos: Excel, Python, R (Studio), SPSS
functions: Description, VBA (Excel), Python, R (Studio)
Cohen's g
Effect size for a one-sample binomial test. Discussed here.
videos: Concept, Excel, Python, R (Studio), SPSS
functions: Description, VBA (Excel), Python, R (Studio)
Cohen's h2
Effect size for a one-sample binary test. Discussed here.
videos: Concept, Excel, Python, R (Studio), SPSS
functions: Description, VBA (Excel), Python, R (Studio)
Cohen's w
Effect size for a chi-square goodness-of-fit test. Discussed here.
videos: Excel, Python, R (Studio), SPSS (not possible?)
functions: Description, VBA (Excel), Python, R (Studio)
compound bar-chart
see 'bar chart (compound or stacked)'
consensus (measure of dispersion)
a measure of dispersion that could be used with an ordinal variable. Discussed here.
videos: Excel, Python, R (Studio), SPSS (not possible).
contingency table
“tables arising when observations on a number of categorical variables are cross-classified” (Everitt, 2004, p.89). Discussed here.
videos: Excel, Python, R (Studio), SPSS.
Cramér's V - goodness-of-fit
Effect size for a chi-square goodness-of-fit test. Discussed here.
videos: Concept, Excel, Python, R (Studio), SPSS
functions: Description, VBA (Excel), Python, R (Studio)
cross table
see contingency table. Discussed here.
cumulative frequency
"the total (absolute) frequency up to the upper boundary of that class" (Kenney, 1939, p. 16). Discussed here.
cumulative percent
the running total of the Valid Percent. Discussed here.
D
descriptive statistics
“methods for organizing, displaying, and describing data using tables, graphs and summary measures” (Mann, 1991, 2010, p. 3). Discussed here.
video: Concept
dichotomous measurement level
A variable where the scores are only consisting of two categories. Also known as binary. Discussed here.
See also measurement level
dominance
An effect size measure that could be used with a test that uses an ordinal variable. Discussed here.
functions: Description, VBA (Excel), Python, R (Studio)
dot plot
"an alternative to a bar chart or line graph when there are very few data values. Each value is recorded as a dot, so that the frequencies for each value can easily be counted" (Upton & Cook, 2014, p. 129). Discussed here.

videos: Concept, Excel, Python, R (Studio), SPSS
dual axis bar-chart
see 'bar chart (dual axis)'
E
equal distance method
Method used in calculation for a two-sided binomial test. Discussed here.
see also binomial test (one-sample)
expected count
The count (absolute frequency) expected in the population. Discussed first here.
F
frequency table
Table showing the different categories and counts. Discussed here.
videos: Concept, Excel, Python, R (Studio), SPSS
G
G test - goodness-of-fit
Test for a single nominal variable. Compares proportions from different categories. Also known as Likelihood Ratio or Wilks goodness-of-fit. Discussed here.
videos: Excel, Python, R (Studio), SPSS (not possible?)
functions: Description, VBA (Excel), Python, R (Studio)
H
Hedges g (one-sample)
effect size measure for a single scale test. Discussed here.
functions: Description, VBA (Excel), Python, R (Studio)
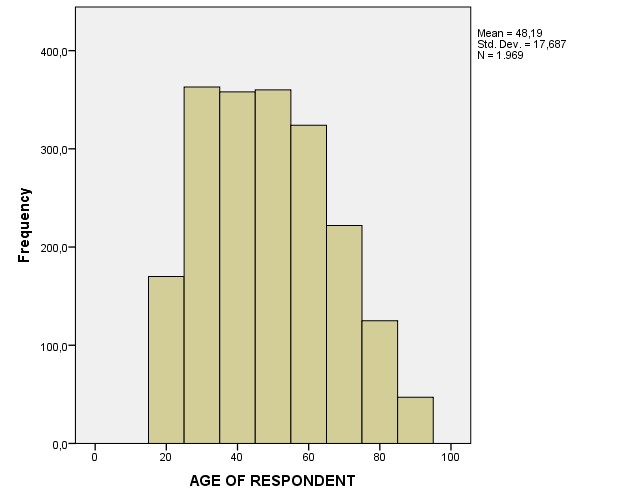
histogram - simple
a chart of a scale variable binned. Discussed here.
videos: Excel, Python, R (Studio), SPSS
I
inference
“a conclusion about a population based on logical reasoning from data gathered about a smaller sample” (Zedeck, 2014, p. 175). Discussed here.
video: Concept
inferential statistics
the field of statistics that tries to say something about a population, based on a sample from that population. Discussed here.
video: Concept
interval measurement level
A variable that is a scale measurement level but lacks an absolute zero. Discussed here.
See also measurement level
J
Johnston-Berry-Mielke E
Effect size for a chi-square or likelihood ratio goodness-of-fit test. Discussed here.
videos: Excel, Python, R (Studio), SPSS (not possible?)
functions: Description, VBA (Excel), Python, R (Studio)
L
likelihood ratio test - goodness-of-fit
See G test - goodness-of-fit.
lower bound
the lower value of a bin or interval. Discussed here.
M
Marimekko chart
alternative name for mosaic plot, although according to Wikipedia "mosaic plots can be colored and shaded according to deviations from independence, whereas Marimekko charts are colored according to the category levels" (Wikipedia, 2022).
Discussed here.
mean
a term that could refer to various measures of central tendency, but usually the arithmetic mean is intended (but could for example also be geometric mean, harmonic mean, etc. See arithmetic mean for more details.
median
“the middle value in a distribution, below and above which lie values with equal total frequencies or probabilities” (Porkess, 1991, p. 134). . Discussed here.
videos: Excel, Python, R (Studio), SPSS
mode
“the most common value obtained in a set of observations” (Weisstein, 2002). Discussed here.
videos: Concept, Excel, Python, R (Studio), SPSS
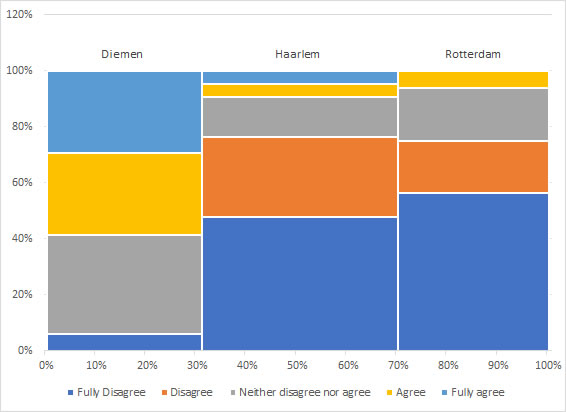
mosaic plot
“special type of stacked bar chart that shows percentages of data in groups. The plot is a graphical representation of a contingency table” (jmp, n.d.). The spineplot is a special case when only two variables are used. Discussed here.
multimodal
Generic term for a dataset with more than one mode. Mentioned here.
multinomial test - goodness-of-fit (one-sample)
Test for a single nominal variable. Compares proportions from different categories. Discussed here.
videos: Excel, Python, R (Studio), SPSS
functions: Description, VBA (Excel), Python, R (Studio)
multiple bar-chart
see 'bar chart (clustered or multiple)'
N
nominal measurement level
A variable where the scores have no logical order. Discussed here.
See also measurement level
null hypothesis
Assumption about the population that is going to be tested. Discussed here.
O
ogive
"the graphs of cumulative frequencies" (Kenney, 1939). Often added in a Pareto chart. Mentioned here.
ordinal measurement level
A variable where the scores have a logical order, but no equal distance between them. Discussed here.
See also measurement level
P
Pareto chart
a bar chart where the bars are placed in descending order of frequency. Usually an ogive is added in the chart as well. Discussed here.

videos: Concept, Excel, Python, R (Studio), SPSS
Pearson chi-square test - goodness-of-fit
Test for a single nominal variable. Compares proportions from different categories. Discussed here.
videos: Concept, Excel, Python, R (Studio), SPSS
functions: Description, VBA (Excel), Python, R (Studio)
Pearson (E.S) correction
Correction if a categorical data is tested using a continuous distribution. First discussed here.
see also Wald and Score test (one-sample)
percent
“a way of expressing ratios in terms of whole numbers. A ratio or fraction is converted to a percentage by multiplying by 100 and appending a "percentage sign" %” (Weisstein, 2002, p. 2200). Could include the missing values, depending on the context. Discussed here.
See also frequency table
pie chart
“a graphic display in which a circle is cut into wedges with the area of each wedge being proportional to the percentage of cases in the category represented by that wedge” (Zedeck, 2014, p. 260). Discussed here.

videos: Concept, Excel, Python, R (Studio), SPSS
population
“the complete set of objects of interest” (Upton & Cook, 2014, p. 332). Discussed here.
video: Concept
Pratt method
A method to keep scores that are equal to the hypothesized median in a Wilcoxon test. Discussed here.
R
rank biserial correlation coefficient (one-sample)
An effect size measure that could be used with a single ordinal variable. Discussed here.
videos: Excel, Python, SPSS (with a little Excel)
functions: Description, VBA (Excel), Python, R (Studio)
ratio measurement level
A variable that is a scale measurement level and has an absolute zero. Discussed here.
See also measurement level
relative frequency
“[absolute frequency] expressed as a fraction of the total frequency” (Kenney & Keeping, 1954, p. 17). Discussed here.
See also frequency table
Rosenthal correlation coefficient
An effect size measure that could be used with a test that uses a normal distribution. Discussed here.
functions: Description, VBA (Excel), Python, R (Studio)
S
sample
“a subset of a population usually chosen in such a way that it can be taken to represent the population with respect to some characteristic” (Upton & Cook, 2014, p. 379). Discussed here.
video: Concept
sampling technique
“the process of selecting a limited number of units from a larger set for a study” (Zedeck, 2014, p. 322). Mentioned here.
video: Concept
statistics
“the science of collecting, displaying and analysing data” (Upton & Cook, 2014, p. 429). Discussed here.
video: Concept
scale measurement level
A variable where the scores are truely numeric. Discussed here.
See also measurement level
score test (one-sample)
test with a single binary variable
videos: Concept, Excel, Python, R (Studio), SPSS
functions: Description, VBA (Excel), Python, R (Studio)
sign test (one-sample)
test with a single ordinal variable
videos: Excel, Python, R (Studio), SPSS (not possible?)
functions: Description, VBA (Excel), Python, R (Studio)
significance
The probability of a result as in the sample, or more extreme, if the assumption about the population would be true. Also referred to as p-value. Discussed here.
video: Concept
small p method
Method used in calculation for a two-sided binomial test. Discussed here.
see also binomial test (one-sample)
spine plot
a compound bar chart showing multiple bars stacked at each x-axis category, the width of each stacked bar is proportional to the total of the entire category. Discussed here.
videos: Excel, R (Studio), SPSS (not possible?).
spinogram
a spineplot when the stacked variable is a binned scale variable.
square root choice
A method to determine the number of bins to use. Discussed here.
stacked bar-chart
see 'bar chart (compound or stacked)'
standard deviation
roughly the average difference from the mean. Discussed here.
videos: Excel, Python, R (Studio), SPSS
Student t-test (one-sample)
test for a single mean. Discussed here.
videos: Excel, Python, R (Studio), SPSS
functions: Description, VBA (Excel), Python, R (Studio)
T
Tchebyshev’s inequality
see Chebyshev’s inequality
three quarter high rule
A rule of thumb for the size of a bar chart. Discussed here.
ties correction
A correction often used in a Wilcoxon test, in case not all scores are unique. Discussed here.
type I/II error
Accepting or rejecting the null hypothesis if the opposite is actually true. Discussed here.
U
unimodal
Dataset with one mode. Mentioned here.
upper bound
the upper/end value of a bin or interval. Discussed here.
V
valid percent
The count for a category if the total sample size would have been 100, using the total cases excluding missing values. Discussed here.
See also frequency table
variation ratio
Measure of dispersion for a nominal variable. It is the proportion that does not belong to the modal category (Zedeck, 2014, p.406).. Discussed here.
videos: Excel, Python, R (Studio), SPSS (not possible)
W
Wald test (one-sample)
test with a single binary variable
videos: Concept, Excel, Python, R (Studio), SPSS
functions: Description, VBA (Excel), Python, R (Studio)
Wilcoxon signed rank test (one-sample)
A test that can be used with a single ordinal variable, to check if data shows a significant difference from an hypothesized median. Discussed here.
videos: Excel, Python, R (Studio), SPSS
functions: Description, VBA (Excel), Python, R (Studio)
Wilk test - goodness-of-fit
See G test - goodness-of-fit.
Williams correction
Correction if a categorical data is tested using a continuous distribution. First discussed here.
see also Wald and Score test (one-sample)
Y
Yates correction
Correction if a categorical data is tested using a continuous distribution. Can be used for example in a Wald test (one sample) or Score test (one sample) discussed here, or a Pearson test of goodness-of-fit or G-test of goodness-of-fit as discussed here.
Z
z-split method
A method to keep scores that are equal to the hypothesized median in a Wilcoxon test. Discussed here.
template
description. Discussed here.
videos: Concept, Excel, Python, R (Studio), SPSS
functions: Description, VBA (Excel), Python, R (Studio)

Google adds